
13 November 2026
Data as at 11 November 2026
Market corrections are normal. Staying invested, and investing regularly, still matters.
Allan Shine, CFP® / Founder, Central Advisors Limited
When markets fall, the headlines can make it feel unprecedented. I have sat with enough clients, in enough of those weeks, to know how unsettling that is. The instinct to do something (often to sell) is very human. Corrections are a normal part of how markets work. What tends to matter more, over years rather than days, is whether you stay invested through them, and whether you keep contributing when prices are lower as well as when they are higher.
What the record actually shows
We looked at the S&P 500, a widely used measure of large US company share prices, from the 9 March 2009 closing low of the 2007 to 2009 bear market to 11 November 2026. Using closing prices only, we counted every decline of 5% or more from a running peak until that peak was regained, and did not count falls inside a longer recovery again.
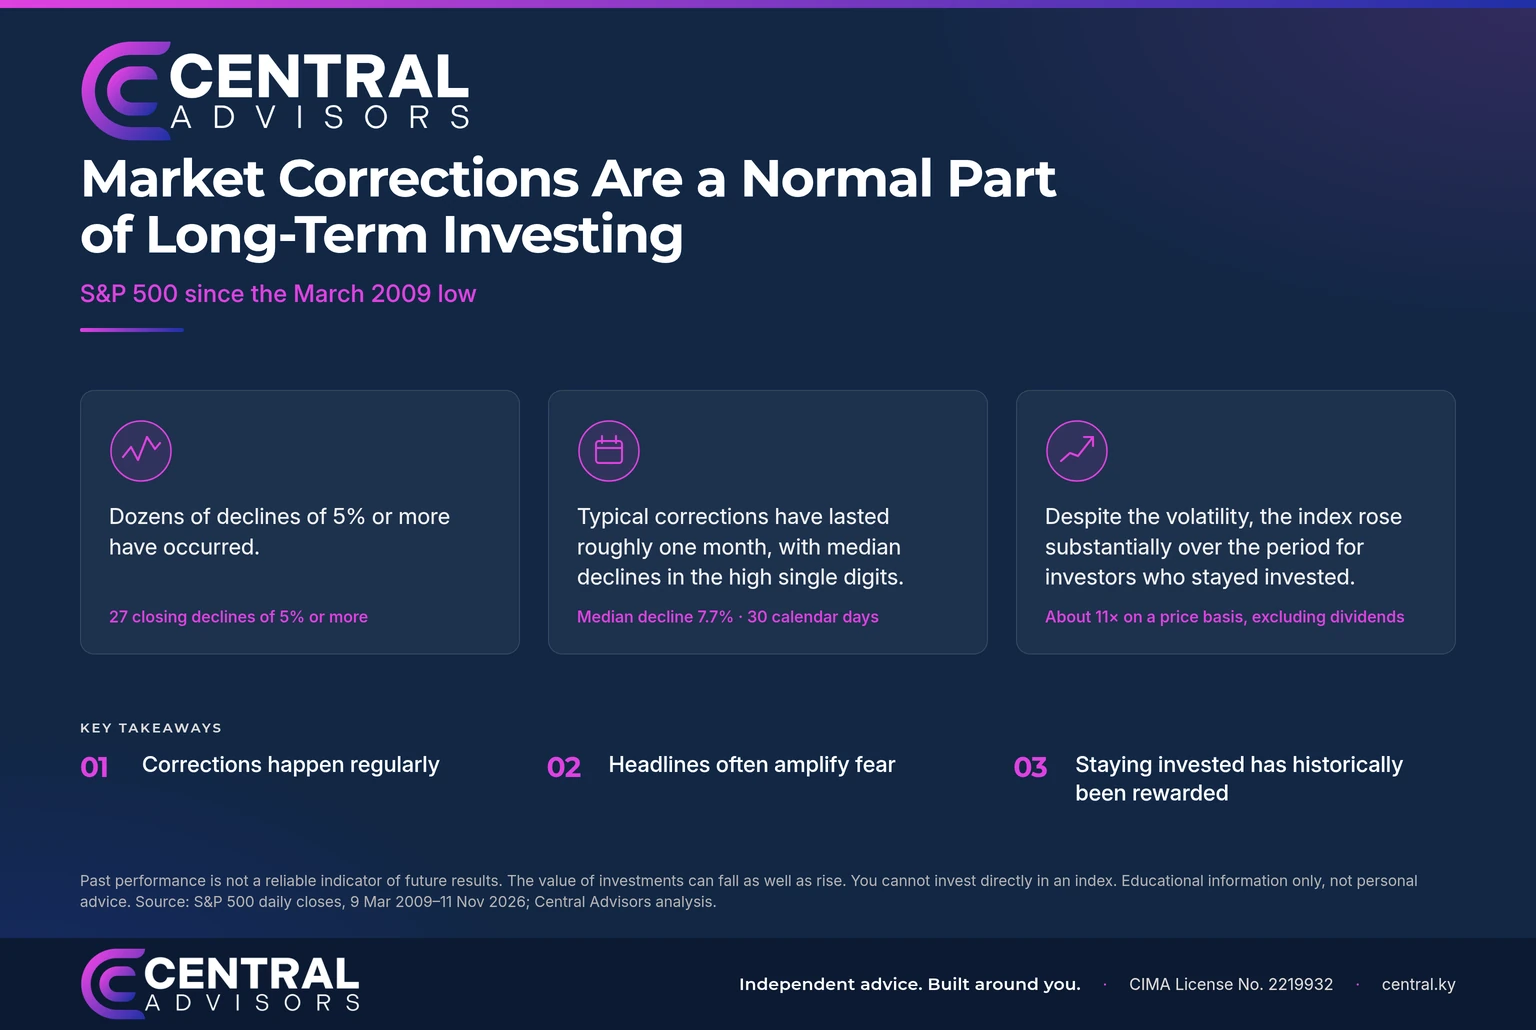
There were 27 such declines. The typical (median) fall was 7.67%, and the typical time from peak to trough was 30 calendar days (about a month). Over the same period the index price rose from 676.53 to 7,619.38, a multiple of 11.26 times, through all 27 of those falls.
Those figures need caveats. The starting point is a major market low, so the rise would look smaller from an earlier or later date. The 11.26 times figure is the price index only: it excludes dividends, fees and charges, and is not what any individual investor would have earned. You cannot invest directly in an index. These are descriptive figures for this period, not a forecast. Of the 27 declines, 26 later closed back at or above their prior peak. One, from a close of 7,818.93 on 6 October 2026, had not done so as at 11 November 2026. Its lowest close so far is provisional.
The falls that felt anything but normal
Some episodes were much deeper than the median. In early 2020, during the pandemic, the index fell 33.92% from 19 February to 23 March, in 33 calendar days. In 2022, amid inflation and rising interest rates, it fell 25.43% from 3 January to 12 October, and did not close back at that January peak until 19 January 2024.
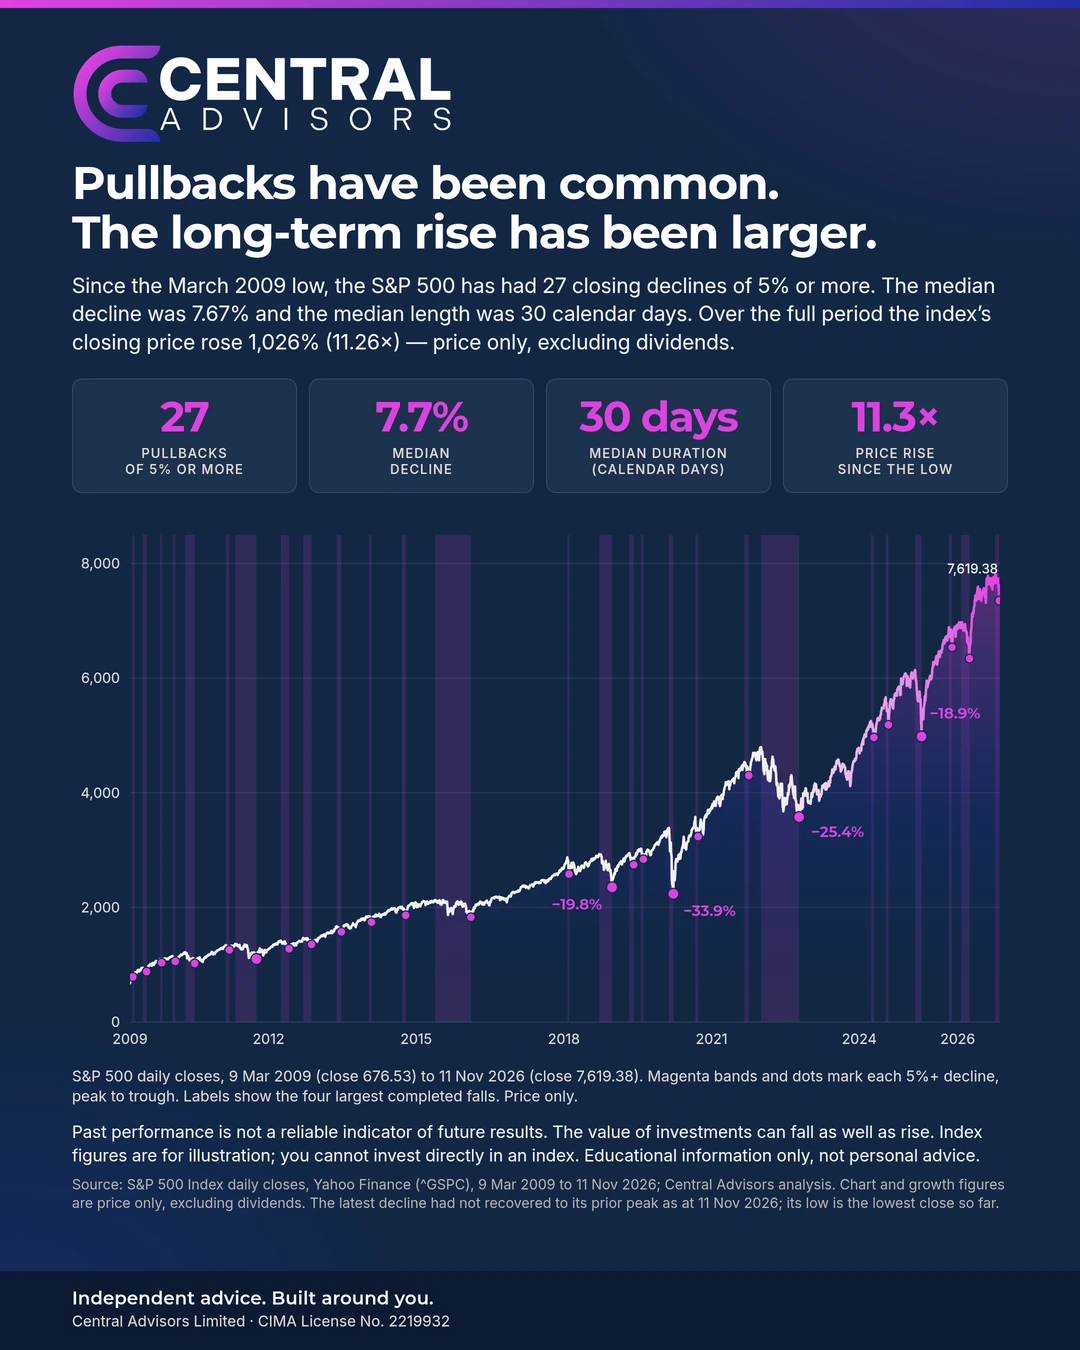
A past recovery does not mean a current or future decline will recover, or will do so on a similar timetable. Markets can fall, and they can stay lower for longer than anyone would like. The chart is not a claim that every dip is harmless. It shows that declines of this kind have been a recurring part of a long upward period.
Why staying invested matters
If you sell after a fall, you turn a paper loss into a real one, and you may not be invested when prices recover. The long rise in this particular index happened through those 27 declines, not on a calm, uninterrupted path.
That is not an argument for holding an unsuitable investment, or for ignoring a change in your circumstances. It is an argument against letting a short, noisy period undo a long-term plan. And it is not a promise. Past performance is not a reliable indicator of future results. The value of investments can fall as well as rise.
The case for investing a little, regularly
Staying invested is one half of the habit. The other is continuing to contribute.
A regular monthly investment, sometimes called dollar-cost averaging, means you put in the same amount on a set schedule, whether markets have just risen or just fallen. When prices are lower, that fixed amount buys more units; when they are higher, it buys fewer. Over time your average purchase price is smoothed, rather than depending on a single day’s timing.
I am not going to attach a made-up illustration to that idea. If corrections are a normal part of the journey, a regular contribution is one practical way of remaining invested through them, instead of trying to pick the perfect moment. For many households I speak to in Cayman, the question is how to put a sensible amount aside, month after month, towards a long-term goal.
Regular premium plans are long-term commitments. They may have charges and early surrender penalties. If you stop or cash in early, you may get back less than you have put in. They will not be right for everyone, which is why the starting point should be a conversation about your circumstances, your time horizon and what the money is for.
Starting from US$250 a month
If you would like to explore a regular premium investment, we can look at options starting from just US$250 a month. We advise and arrange through established international investment platforms. We do not hold your assets; they are held by the platform or custodian. We may receive fees or commission from providers; details are available on request.
This article is educational information only, not personal advice, and not a recommendation to start, stop or change any investment. To talk it through, please book a call, message us on WhatsApp at +1 345-937-5037, call the office on +1 345-743-4673, or email info@central.ky. You can also visit central.ky.
I am always happy to have that conversation. The aim is a plan you can live with in the quiet months and in the noisy ones.
Allan Shine, CFP®
Founder, Central Advisors Limited
Past performance is not a reliable indicator of future results. The value of investments can fall as well as rise, and you may get back less than you invest. Regular premium plans are long-term and may have charges and early surrender penalties; if you cash in early you may get back less than you have put in. Index figures are for illustration; you cannot invest directly in an index. Figures are S&P 500 daily closing prices from 9 March 2009 to 11 November 2026, analysed by Central Advisors from public data (Yahoo Finance ^GSPC, cross-checked against FRED SP500 where the series overlap). Educational information only, not personal advice.
Central Advisors Limited is licensed by the Cayman Islands Monetary Authority (CIMA) under a SIBA Advisor and Arranger licence, number 2219932. The S&P 500 is a product of S&P Dow Jones Indices. Closing values used here were obtained from Yahoo Finance.